|
![Detailed information about indeces](http://www.worldtrading.net/pictures/stocks.gif) |
|
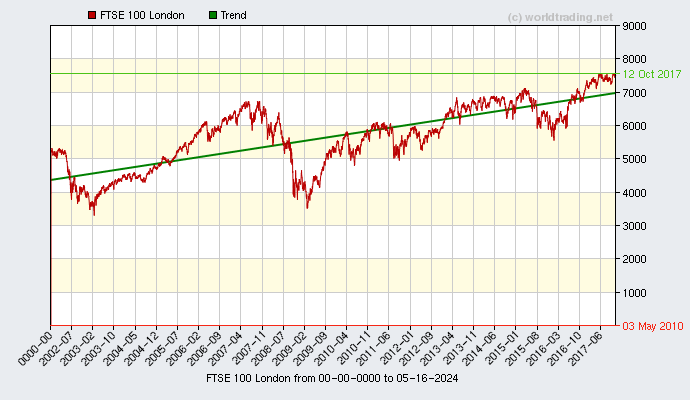
Detailed information for FTSE 100 London |
Symbol: ^FTSE updated: 2017-11-01 20:30:04 |
|
|
|
![Graphical overview and performance from FTSE 100 London showing the performance from 2001 to 07-27-2024](http://www.worldtrading.net/indices/graph_index_line.php?code=^FTSE&desc=FTSE 100 London&top=7556.24,12 Oct 2017&floor=0,03 May 2010) |
Detailed information about FTSE 100 London |
Origin: ![Country United Kingdom Country United Kingdom](http://www.worldtrading.net/flags/uk.png) |
|
Closed: 7487.96 |
|
Hig: 7532.36 |
|
Low: 7487.96 |
|
Open: 7493.08 |
|
Last: 01 Nov 2017 |
|
Change: -5.12 |
|
![FTSE had a change of -5.12 FTSE had a change of -5.12](http://www.worldtrading.net/pictures/down.gif) |
|
|
High and low, best and worst performance since 2001 |
|
Best: 7556.24 on: 12 Oct 2017 |
|
Worst: 0 on: 03 May 2010 |
|
52 weeks average: 0 |
|
|
|
|
|
![Worldrading money converter, airplane, airport and airline information Worldrading money converter, airplane, airport and airline information](http://www.worldtrading.net/pictures/spacer.gif) |
|
![Worldrading stocks, indices, currency history Worldrading stocks, indices, currency history](http://www.worldtrading.net/pictures/spacer.gif) |
|
|
|