|
 |
| |
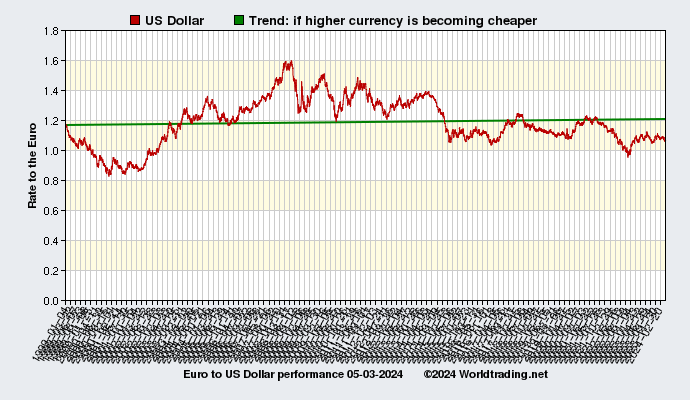
Analysis of US Dollar from 01-04-1999 to 07-27-2024 |
Currency code: USD Country: United States Records: 6546 |
|
|
|
 |
| Performance US Dollar to the Euro |
|
| Current value: | 1.08600 |
|
Last update: | 2024-07-26 |
|
1 USD: | 0.92 Euro |
|
Country code: | US |
|
Country flag: |  |
|
|
| High and low, best and worst performance |
|
| Best performance: |
0.82520 |
on date: |
2000-10-26 |
|
Worst performance: |
1.59900 |
on date: |
2008-07-15 |
|
|
| Currency status summary |
|
In other words, on 2000-10-26 one Euro was 0.82520 US Dollar, the worst performance was on 2008-07-15 you could get 1.59900 US Dollar for one Euro.
The average currency rate of the US Dollar over the last 2 months was 1.08083 to 1 Euro, that is a difference of -0.48% to the current value, so it is losing value to the Euro, or in simple words: the US Dollar is getting cheaper as you can see in the last month graph below.
|
|
| US Dollar last month |
|
 |
|
|
 |
|
|
|
|
|
|