|
 |
| |
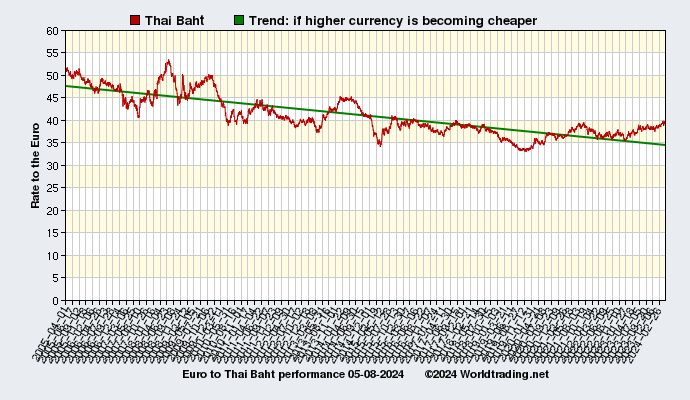
Analysis of Thai Baht from 04-01-2005 to 07-27-2024 |
Currency code: THB Country: Thailand Records: 4947 |
|
|
|
 |
| Performance Thai Baht to the Euro |
|
| Current value: | 39.11200 |
|
Last update: | 2024-07-26 |
|
1 THB: | 0.03 Euro |
|
Country code: | TH |
|
Country flag: |  |
|
|
| High and low, best and worst performance |
|
| Best performance: |
33.20400 |
on date: |
2019-11-29 |
|
Worst performance: |
53.53600 |
on date: |
2008-07-15 |
|
|
| Currency status summary |
|
In other words, on 2019-11-29 one Euro was 33.20400 Thai Baht, the worst performance was on 2008-07-15 you could get 53.53600 Thai Baht for one Euro.
The average currency rate of the Thai Baht over the last 2 months was 39.48718 to 1 Euro, that is a difference of 0.96% to the current value, so it is gaining value to the Euro, or in simple words: the Thai Baht is getting more expensive as you can see in the last month graph below.
|
|
| Thai Baht last month |
|
 |
|
|
 |
|
|
|
|
|
|