|
 |
| |
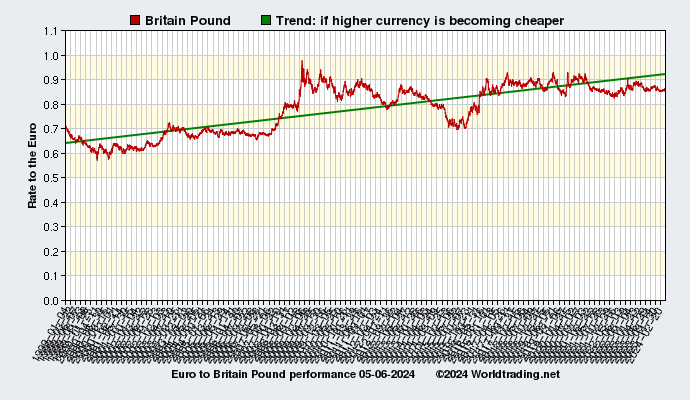
Analysis of Britain Pound from 01-04-1999 to 07-27-2024 |
Currency code: GBP Country: United Kingdom Records: 6546 |
|
|
|
 |
| Performance Britain Pound to the Euro |
|
| Current value: | 0.84378 |
|
Last update: | 2024-07-26 |
|
1 GBP: | 1.19 Euro |
|
Country code: | GB |
|
Country flag: |  |
|
|
| High and low, best and worst performance |
|
| Best performance: |
0.57110 |
on date: |
2000-05-03 |
|
Worst performance: |
0.97855 |
on date: |
2008-12-29 |
|
|
| Currency status summary |
|
In other words, on 2000-05-03 one Euro was 0.57110 Britain Pound, the worst performance was on 2008-12-29 you could get 0.97855 Britain Pound for one Euro.
The average currency rate of the Britain Pound over the last 2 months was 0.84561 to 1 Euro, that is a difference of 0.22% to the current value, so it is gaining value to the Euro, or in simple words: the Britain Pound is getting more expensive as you can see in the last month graph below.
|
|
| Britain Pound last month |
|
 |
|
|
 |
|
|
|
|
|
|